240925
복습
In [5]:
import numpy as np
import pandas as pd
import matplotlib.pyplot as plt
In [10]:
# 타이타닉 데이터
path = 'https://raw.githubusercontent.com/DA4BAM/dataset/master/titanic_simple.csv'
titanic = pd.read_csv(path)
titanic.head()
Out[10]:
PassengerIdSurvivedPclassNameSexAgeFareEmbarked01234
| 1 | 0 | 3 | Braund, Mr. Owen Harris | male | 22.0 | 7.2500 | Southampton |
| 2 | 1 | 1 | Cumings, Mrs. John Bradley (Florence Briggs Th... | female | 38.0 | 71.2833 | Cherbourg |
| 3 | 1 | 3 | Heikkinen, Miss. Laina | female | 26.0 | 7.9250 | Southampton |
| 4 | 1 | 1 | Futrelle, Mrs. Jacques Heath (Lily May Peel) | female | 35.0 | 53.1000 | Southampton |
| 5 | 0 | 3 | Allen, Mr. William Henry | male | 35.0 | 8.0500 | Southampton |
In [13]:
# 대기 데이터
path = 'https://raw.githubusercontent.com/DA4BAM/dataset/master/air2.csv'
air = pd.read_csv(path)
air.head()
Out[13]:
OzoneSolar.RWindTempDate01234
| 41 | 190.0 | 7.4 | 67 | 1973-05-01 |
| 36 | 118.0 | 8.0 | 72 | 1973-05-02 |
| 12 | 149.0 | 12.6 | 74 | 1973-05-03 |
| 18 | 313.0 | 11.5 | 62 | 1973-05-04 |
| 19 | NaN | 14.3 | 56 | 1973-05-05 |
In [21]:
# 칼럼 이름만 리스트에 담아 조회
# 방법1
col_names = list(titanic)
col_names

# 방법2
col_names = list(titanic.columns)
col_names
Out[21]:
['PassengerId', 'Survived', 'Pclass', 'Name', 'Sex', 'Age', 'Fare', 'Embarked']In [26]:
# 타이타닉 객실 등급(Pclass) 1등급, 나이(Age) 10살 이하 탑승객 조회
titanic.loc[(titanic['Pclass'] == 1) & (titanic['Age'] <= 10)]
titanic.head()
Out[26]:
PassengerIdSurvivedPclassNameSexAgeFareEmbarked01234
| 1 | 0 | 3 | Braund, Mr. Owen Harris | male | 22.0 | 7.2500 | Southampton |
| 2 | 1 | 1 | Cumings, Mrs. John Bradley (Florence Briggs Th... | female | 38.0 | 71.2833 | Cherbourg |
| 3 | 1 | 3 | Heikkinen, Miss. Laina | female | 26.0 | 7.9250 | Southampton |
| 4 | 1 | 1 | Futrelle, Mrs. Jacques Heath (Lily May Peel) | female | 35.0 | 53.1000 | Southampton |
| 5 | 0 | 3 | Allen, Mr. William Henry | male | 35.0 | 8.0500 | Southampton |
In [38]:
# 타이타닉 객실 등급(Pclass) 별 탑승객 수

# groupby()
display(titanic.groupby('Pclass', as_index = False)[['PassengerId']].count())


# value_counts()
titanic['Pclass'].value_counts()
PclassPassengerId012
| 1 | 216 |
| 2 | 184 |
| 3 | 491 |
Out[38]:
Pclass
3    491
1    216
2    184
Name: count, dtype: int64
In [55]:
# 타이타닉 성별 남자와 여자 탑승객의 나이를 각각 저장
app_male = titanic.loc[titanic['Sex'] == 'male', 'Age']
app_male = pd.DataFrame(app_male)
app_male
Out[55]:
Age04567...883884886889890
| 22.0 |
| 35.0 |
| NaN |
| 54.0 |
| 2.0 |
| ... |
| 28.0 |
| 25.0 |
| 27.0 |
| 26.0 |
| 32.0 |
577 rows × 1 columns
In [57]:
app_female = titanic.loc[titanic['Sex'] == 'female', 'Age']
app_female
Out[57]:
1      38.0
2      26.0
3      35.0
8      27.0
9      14.0
       ...
880    25.0
882    22.0
885    39.0
887    19.0
888     NaN
Name: Age, Length: 314, dtype: float64
In [74]:
# 타이타닉 나이(Age)에 NaN이 아닌 탑승객 조회
titanic = titanic.loc[titanic['Age'].notnull()]
display(titanic)
print('Age 결측치 개수:',titanic['Age'].isnull().sum())
PassengerIdSurvivedPclassNameSexAgeFareEmbarked01234...885886887889890
| 1 | 0 | 3 | Braund, Mr. Owen Harris | male | 22.0 | 7.2500 | Southampton |
| 2 | 1 | 1 | Cumings, Mrs. John Bradley (Florence Briggs Th... | female | 38.0 | 71.2833 | Cherbourg |
| 3 | 1 | 3 | Heikkinen, Miss. Laina | female | 26.0 | 7.9250 | Southampton |
| 4 | 1 | 1 | Futrelle, Mrs. Jacques Heath (Lily May Peel) | female | 35.0 | 53.1000 | Southampton |
| 5 | 0 | 3 | Allen, Mr. William Henry | male | 35.0 | 8.0500 | Southampton |
| ... | ... | ... | ... | ... | ... | ... | ... |
| 886 | 0 | 3 | Rice, Mrs. William (Margaret Norton) | female | 39.0 | 29.1250 | Queenstown |
| 887 | 0 | 2 | Montvila, Rev. Juozas | male | 27.0 | 13.0000 | Southampton |
| 888 | 1 | 1 | Graham, Miss. Margaret Edith | female | 19.0 | 30.0000 | Southampton |
| 890 | 1 | 1 | Behr, Mr. Karl Howell | male | 26.0 | 30.0000 | Cherbourg |
| 891 | 0 | 3 | Dooley, Mr. Patrick | male | 32.0 | 7.7500 | Queenstown |
714 rows × 8 columns
Age 결측치 개수: 0
In [88]:
# 오존 농도 10 ~ 20 사이 데이터 조회
# 10 이상 20 이하
air.loc[air['Ozone'].between(10,20)]
Out[88]:
OzoneSolar.RWindTempDate23479111213141519212425263348495072818694129137139140142143147150151152
| 12 | 149.0 | 12.6 | 74 | 1973-05-03 |
| 18 | 313.0 | 11.5 | 62 | 1973-05-04 |
| 19 | NaN | 14.3 | 56 | 1973-05-05 |
| 19 | 99.0 | 13.8 | 59 | 1973-05-08 |
| 20 | 194.0 | 8.6 | 69 | 1973-05-10 |
| 16 | 256.0 | 9.7 | 69 | 1973-05-12 |
| 11 | 290.0 | 9.2 | 66 | 1973-05-13 |
| 14 | 274.0 | 10.9 | 68 | 1973-05-14 |
| 18 | 65.0 | 13.2 | 58 | 1973-05-15 |
| 14 | 334.0 | 11.5 | 64 | 1973-05-16 |
| 11 | 44.0 | 9.7 | 62 | 1973-05-20 |
| 11 | 320.0 | 16.6 | 73 | 1973-05-22 |
| 17 | 66.0 | 16.6 | 57 | 1973-05-25 |
| 18 | 266.0 | 14.9 | 58 | 1973-05-26 |
| 15 | NaN | 8.0 | 57 | 1973-05-27 |
| 18 | 242.0 | 16.1 | 67 | 1973-06-03 |
| 20 | 37.0 | 9.2 | 65 | 1973-06-18 |
| 12 | 120.0 | 11.5 | 73 | 1973-06-19 |
| 13 | 137.0 | 10.3 | 76 | 1973-06-20 |
| 10 | 264.0 | 14.3 | 73 | 1973-07-12 |
| 16 | 7.0 | 6.9 | 74 | 1973-07-21 |
| 20 | 81.0 | 8.6 | 82 | 1973-07-26 |
| 16 | 77.0 | 7.4 | 82 | 1973-08-03 |
| 20 | 252.0 | 10.9 | 80 | 1973-09-07 |
| 13 | 112.0 | 11.5 | 71 | 1973-09-15 |
| 18 | 224.0 | 13.8 | 67 | 1973-09-17 |
| 13 | 27.0 | 10.3 | 76 | 1973-09-18 |
| 16 | 201.0 | 8.0 | 82 | 1973-09-20 |
| 13 | 238.0 | 12.6 | 64 | 1973-09-21 |
| 14 | 20.0 | 16.6 | 63 | 1973-09-25 |
| 14 | 191.0 | 14.3 | 75 | 1973-09-28 |
| 18 | 131.0 | 8.0 | 76 | 1973-09-29 |
| 20 | 223.0 | 11.5 | 68 | 1973-09-30 |
In [90]:
# 10 초과 20 이하
air.loc[air['Ozone'].between(10,20, inclusive = 'right')]
Out[90]:
OzoneSolar.RWindTempDate234791112131415192124252633484950818694129137139140142143147150151152
| 12 | 149.0 | 12.6 | 74 | 1973-05-03 |
| 18 | 313.0 | 11.5 | 62 | 1973-05-04 |
| 19 | NaN | 14.3 | 56 | 1973-05-05 |
| 19 | 99.0 | 13.8 | 59 | 1973-05-08 |
| 20 | 194.0 | 8.6 | 69 | 1973-05-10 |
| 16 | 256.0 | 9.7 | 69 | 1973-05-12 |
| 11 | 290.0 | 9.2 | 66 | 1973-05-13 |
| 14 | 274.0 | 10.9 | 68 | 1973-05-14 |
| 18 | 65.0 | 13.2 | 58 | 1973-05-15 |
| 14 | 334.0 | 11.5 | 64 | 1973-05-16 |
| 11 | 44.0 | 9.7 | 62 | 1973-05-20 |
| 11 | 320.0 | 16.6 | 73 | 1973-05-22 |
| 17 | 66.0 | 16.6 | 57 | 1973-05-25 |
| 18 | 266.0 | 14.9 | 58 | 1973-05-26 |
| 15 | NaN | 8.0 | 57 | 1973-05-27 |
| 18 | 242.0 | 16.1 | 67 | 1973-06-03 |
| 20 | 37.0 | 9.2 | 65 | 1973-06-18 |
| 12 | 120.0 | 11.5 | 73 | 1973-06-19 |
| 13 | 137.0 | 10.3 | 76 | 1973-06-20 |
| 16 | 7.0 | 6.9 | 74 | 1973-07-21 |
| 20 | 81.0 | 8.6 | 82 | 1973-07-26 |
| 16 | 77.0 | 7.4 | 82 | 1973-08-03 |
| 20 | 252.0 | 10.9 | 80 | 1973-09-07 |
| 13 | 112.0 | 11.5 | 71 | 1973-09-15 |
| 18 | 224.0 | 13.8 | 67 | 1973-09-17 |
| 13 | 27.0 | 10.3 | 76 | 1973-09-18 |
| 16 | 201.0 | 8.0 | 82 | 1973-09-20 |
| 13 | 238.0 | 12.6 | 64 | 1973-09-21 |
| 14 | 20.0 | 16.6 | 63 | 1973-09-25 |
| 14 | 191.0 | 14.3 | 75 | 1973-09-28 |
| 18 | 131.0 | 8.0 | 76 | 1973-09-29 |
| 20 | 223.0 | 11.5 | 68 | 1973-09-30 |
In [94]:
# 대기 데이터에서날짜(Date) 1973-05-01, 1973-06-01, 1973-07-01 , 1973-08-01 인 경우만 조회
air.loc[air['Date'].isin(['1973-05-01', '1973-06-01', '1973-07-01' , '1973-08-01'])]
Out[94]:
OzoneSolar.RWindTempDate0316192
| 41 | 190.0 | 7.4 | 67 | 1973-05-01 |
| 34 | 286.0 | 8.6 | 78 | 1973-06-01 |
| 135 | 269.0 | 4.1 | 84 | 1973-07-01 |
| 39 | 83.0 | 6.9 | 81 | 1973-08-01 |
In [99]:
# 타이타닉 Embarked 변경
titanic['Embarked2'] = titanic['Embarked'].map({'Southampton': 'S', 'Cherbourg': 'C', 'Queenstown': 'Q'})
titanic['Embarked2']
Out[99]:
0      S
1      C
2      S
3      S
4      S
      ..
885    Q
886    S
887    S
889    C
890    Q
Name: Embarked2, Length: 714, dtype: object
In [106]:
# 타이타닉 Fare을 다음 기준으로 변경 : pd.cut()
# <= 30 ==> 'L'
# <= 100 ==> 'M'
# 100 < ==> 'H'

bin = [-np.inf, 30, 100, np.inf]
label = list('LMH')

titanic['Fare2'] = pd.cut(titanic['Fare'], bins = bin, labels = label)
titanic_Fare = pd.DataFrame(titanic['Fare2'])
titanic_Fare
Out[106]:
Fare201234...885886887889890
| L |
| M |
| L |
| M |
| L |
| ... |
| L |
| L |
| L |
| L |
| L |
714 rows × 1 columns
In [112]:
titanic_Fare['Fare2'].value_counts()
Out[112]:
Fare2
L    511
M    155
H     48
Name: count, dtype: int64
In [117]:
# 타이타닉 Sex 변경 np.where
# female ==> 0
# male ==> 1

titanic['Sex2'] = np.where(titanic['Sex'] == 'female', 0, 1)
titanic
Out[117]:
PassengerIdSurvivedPclassNameSexAgeFareEmbarkedEmbarked2Fare2Sex201234...885886887889890
| 1 | 0 | 3 | Braund, Mr. Owen Harris | male | 22.0 | 7.2500 | Southampton | S | L | 1 |
| 2 | 1 | 1 | Cumings, Mrs. John Bradley (Florence Briggs Th... | female | 38.0 | 71.2833 | Cherbourg | C | M | 0 |
| 3 | 1 | 3 | Heikkinen, Miss. Laina | female | 26.0 | 7.9250 | Southampton | S | L | 0 |
| 4 | 1 | 1 | Futrelle, Mrs. Jacques Heath (Lily May Peel) | female | 35.0 | 53.1000 | Southampton | S | M | 0 |
| 5 | 0 | 3 | Allen, Mr. William Henry | male | 35.0 | 8.0500 | Southampton | S | L | 1 |
| ... | ... | ... | ... | ... | ... | ... | ... | ... | ... | ... |
| 886 | 0 | 3 | Rice, Mrs. William (Margaret Norton) | female | 39.0 | 29.1250 | Queenstown | Q | L | 0 |
| 887 | 0 | 2 | Montvila, Rev. Juozas | male | 27.0 | 13.0000 | Southampton | S | L | 1 |
| 888 | 1 | 1 | Graham, Miss. Margaret Edith | female | 19.0 | 30.0000 | Southampton | S | L | 0 |
| 890 | 1 | 1 | Behr, Mr. Karl Howell | male | 26.0 | 30.0000 | Cherbourg | C | L | 1 |
| 891 | 0 | 3 | Dooley, Mr. Patrick | male | 32.0 | 7.7500 | Queenstown | Q | L | 1 |
714 rows × 11 columns
In [119]:
titanic['Sex3'] = titanic['Sex'].replace({'male': 1, 'female':0})
titanic['Sex3']
C:\Users\User\AppData\Local\Temp\ipykernel_20024\3139542529.py:1: FutureWarning: Downcasting behavior in `replace` is deprecated and will be removed in a future version. To retain the old behavior, explicitly call `result.infer_objects(copy=False)`. To opt-in to the future behavior, set `pd.set_option('future.no_silent_downcasting', True)`
  titanic['Sex3'] = titanic['Sex'].replace({'male': 1, 'female':0})
Out[119]:
0      1
1      0
2      0
3      0
4      1
      ..
885    0
886    1
887    0
889    1
890    1
Name: Sex3, Length: 714, dtype: int64
In [ ]:
단변량분석_숫자형
In [140]:
import numpy as np
import pandas as pd
import matplotlib.pyplot as plt
import seaborn as sns
In [141]:
path = 'https://raw.githubusercontent.com/DA4BAM/dataset/master/titanic_simple.csv'
titanic = pd.read_csv(path)
titanic.head()

path = 'https://raw.githubusercontent.com/DA4BAM/dataset/master/air2.csv'
air = pd.read_csv(path)
air.head()
Out[141]:
OzoneSolar.RWindTempDate01234
| 41 | 190.0 | 7.4 | 67 | 1973-05-01 |
| 36 | 118.0 | 8.0 | 72 | 1973-05-02 |
| 12 | 149.0 | 12.6 | 74 | 1973-05-03 |
| 18 | 313.0 | 11.5 | 62 | 1973-05-04 |
| 19 | NaN | 14.3 | 56 | 1973-05-05 |
대푯값
- 평균: mean()
- 중앙값: median()
- 최빈값: mode()
시각화
- 히스토그램: plt.hist(), sns.histplot()
- 밀도함수 그래프: sns.kdeplot()
- boxplot: sns.boxplot()
1. 히스토그램
- plt.hist(변수명, 몇개로 나눌지)
- sns.histplot(x = 열, data = 데이터셋, bins = '몇 개로 나눠')
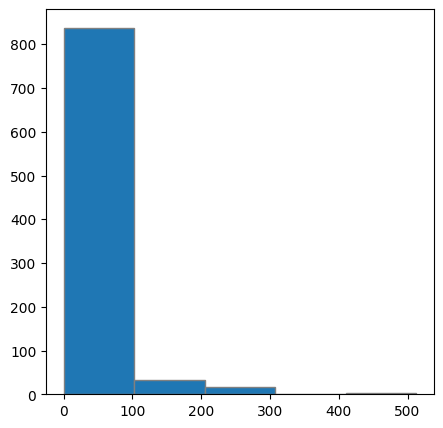
In [176]:
# 타이타닉 Fare에 따라 5개 구간으로 나누기
plt.figure(figsize = (5,5))
plt.hist(titanic['Fare'], 5, edgecolor = 'gray')
plt.show()
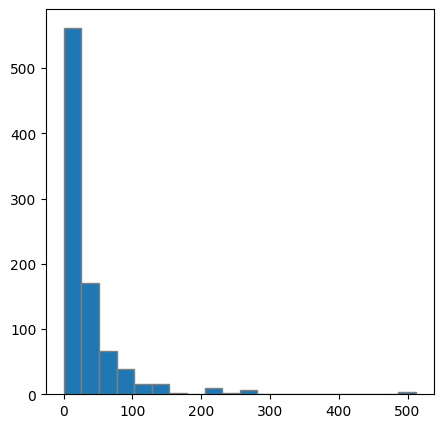
In [178]:
# 구간 개수를 20개로 변경
plt.figure(figsize = (5,5))
plt.hist(titanic['Fare'], 20, edgecolor = 'gray')
plt.show()
In [180]:
# titanic의 Age 칼럼에 대한 히스토그램
# 구간 개수 8, 16, 32, 64

plt.figure(figsize = (8,8))
plt.subplot(2,2,1)
sns.histplot(x = 'Age', data = titanic, bins = 8)


plt.subplot(2,2,2)
sns.histplot(titanic['Age'], bins = 16)


plt.subplot(2,2,3)
sns.histplot(x = 'Age', data = titanic, bins = 32)


plt.subplot(2,2,4)
sns.histplot(titanic['Age'], bins = 64)

# plt.tight_layout() : 플롯의 여백을 자동으로 조절
plt.tight_layout()
plt.show()

2. 밀도추정함수
- 히스토그램의 단점: 구간 너비에 따라 모양이 달라짐
- 모든 점에서 데이터 밀도 추정하는 밀도추정방식으로 히스토그램의 단점 극복
- 밀도함수 그래프 면적은 1
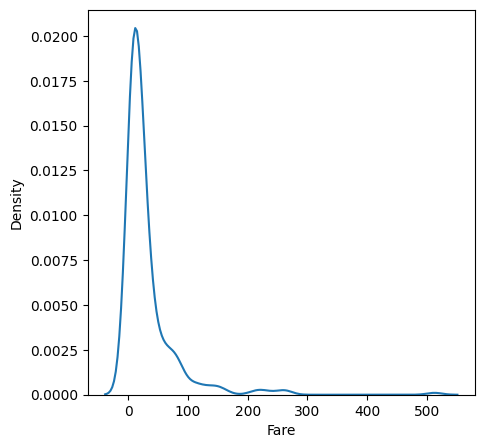
In [195]:
# titanic의 Fare에 대한 밀도함수 그래프kde
plt.figure(figsize = (5,5))
sns.kdeplot(titanic['Fare'])
plt.show()
In [197]:
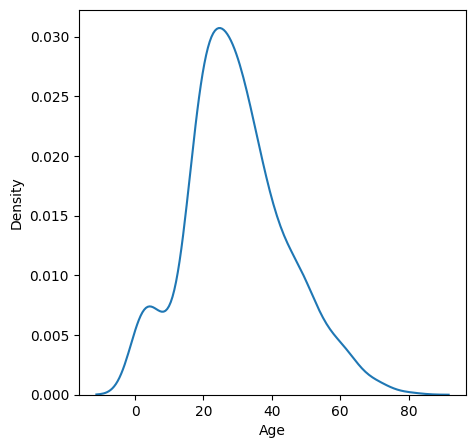
# titanic의 Age에 대한 밀도함수 그래프
plt.figure(figsize = (5,5))
sns.kdeplot(titanic['Age'])
plt.show()
In [208]:
# 주로 히스토그램과 확률밀도함수를 동시에 그림
# kde = True 방법

# titanic의 Age
sns.histplot(titanic['Age'], kde = True)
plt.show()

# 밀집구간 : 20~40, 0~5
# 희박 : 50~ , 5 ~ 15
# 젊은 부부가 어린 아이를 데리고 탔구나~

In [ ]:
Boxplot
- sns.boxplot()
- plt.boxplot()
- NaN 값이 있으면 그래프 그릴 수 없음
In [281]:
path = 'https://raw.githubusercontent.com/DA4BAM/dataset/master/titanic_simple.csv'
titanic = pd.read_csv(path)
titanic.head()
titanic['Age'].isnull().sum()
Out[281]:
177In [291]:
# titanic['Age']의 NaN 제거
# 방법1
titanic.dropna(subset = ['Age'], inplace = True)


# 방법2
titanic.loc[titanic['Age'].notnull()]
Out[291]:
PassengerIdSurvivedPclassNameSexAgeFareEmbarked01234...885886887889890
| 1 | 0 | 3 | Braund, Mr. Owen Harris | male | 22.0 | 7.2500 | Southampton |
| 2 | 1 | 1 | Cumings, Mrs. John Bradley (Florence Briggs Th... | female | 38.0 | 71.2833 | Cherbourg |
| 3 | 1 | 3 | Heikkinen, Miss. Laina | female | 26.0 | 7.9250 | Southampton |
| 4 | 1 | 1 | Futrelle, Mrs. Jacques Heath (Lily May Peel) | female | 35.0 | 53.1000 | Southampton |
| 5 | 0 | 3 | Allen, Mr. William Henry | male | 35.0 | 8.0500 | Southampton |
| ... | ... | ... | ... | ... | ... | ... | ... |
| 886 | 0 | 3 | Rice, Mrs. William (Margaret Norton) | female | 39.0 | 29.1250 | Queenstown |
| 887 | 0 | 2 | Montvila, Rev. Juozas | male | 27.0 | 13.0000 | Southampton |
| 888 | 1 | 1 | Graham, Miss. Margaret Edith | female | 19.0 | 30.0000 | Southampton |
| 890 | 1 | 1 | Behr, Mr. Karl Howell | male | 26.0 | 30.0000 | Cherbourg |
| 891 | 0 | 3 | Dooley, Mr. Patrick | male | 32.0 | 7.7500 | Queenstown |
714 rows × 8 columns
In [295]:
# 확인
titanic['Age'].isnull().sum()
Out[295]:
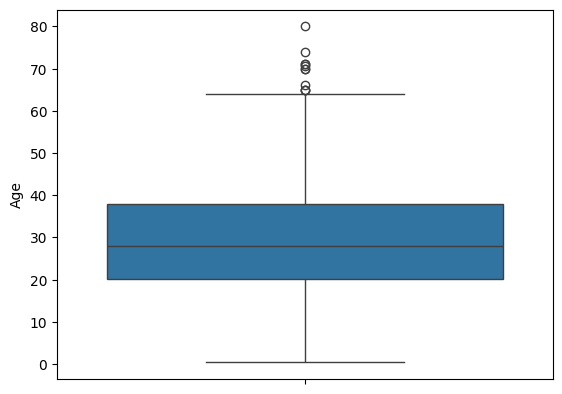
0In [301]:
plt.boxplot(titanic['Age'])
plt.show()

# 수염 밖 부분을 이상치로 판단
# 수염은 IQR * 1.5

In [305]:
plt.boxplot(titanic['Age'], vert = False)
plt.show()

In [307]:
sns.boxplot(titanic['Age'])
plt.show()